
Monitoring
Track Segmind API usage from the console: Generations for individual requests, Cost Analytics for spend, and API Health for latency percentiles, success rate and error breakdown.
Three pages in the console cover usage, and they answer different questions:
| Page | Answers |
|---|---|
| Generations | What did I run? — one row per request, with status, duration, cost and a preview of the output |
| Cost Analytics | What did it cost? — spend over time, broken down by model, source, API key and team member |
| API Health | Is it working, and how fast? — success rate, latency percentiles, and what is failing |
All three are under OBSERVABILITY in the left nav, and all three are scoped to the workspace you are currently in. Switch workspaces at the bottom left before reading any of them — a team's usage does not appear in your Personal account and vice versa. See Teams for how workspaces work.
They update in near real time. A request shows up in Generations within seconds of finishing, and in the other two within a minute or two — there is no batch delay to wait out. If a page looks empty, check the workspace and the date range before assuming the data has not landed yet.
Generations
Every request made from this workspace, newest first.
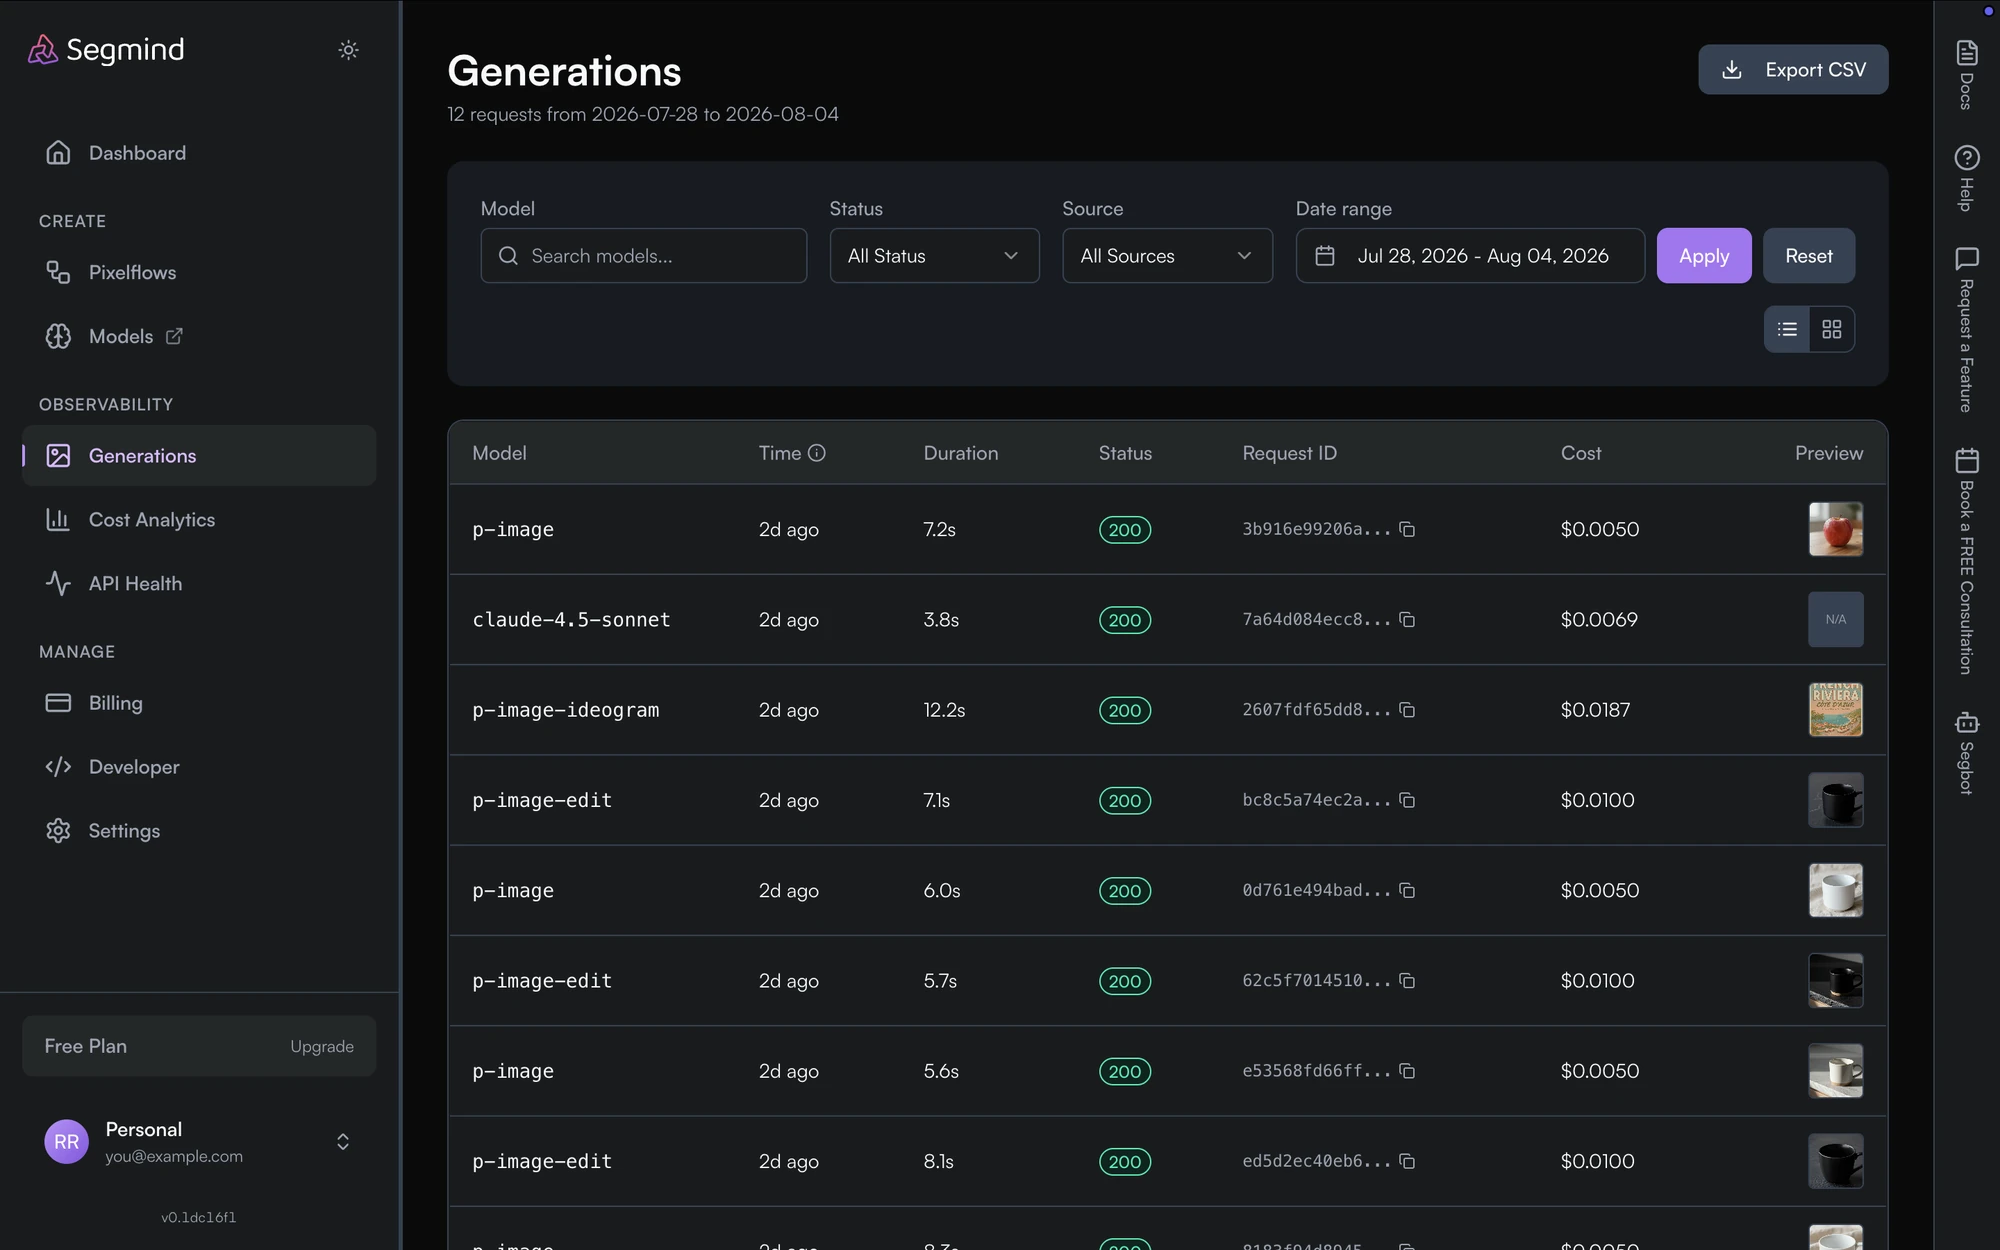
| Column | Shows |
|---|---|
| Model | the model slug that was called |
| Time | when the request was made |
| Duration | how long it took end to end |
| Status | the HTTP status it returned — see API error codes |
| Request ID | the id the gateway assigned, with a copy button |
| Cost | what this single request was charged |
| Preview | a thumbnail of the output, or N/A for models that do not return an image |
Filter by model, status, source or date range, then click Apply. The toggle at the right of the filter bar switches between the list above and a grid of output previews, which is the faster way to find a generation you recognise by sight rather than by id.
Export CSV downloads the filtered set.
Selecting a row opens the full request beside the list — endpoint, request id, status, duration, generation time, when it was created, cost and source, with the prompt and the raw JSON both copyable.
The Request ID column is the same id the v2 async endpoints return. If you are debugging a specific call, copy it here and look it up with async inference rather than scrolling.
Generations does not record which API key a request was made with — for that, use the API key filter and the Cost by API Key table in Cost Analytics.
Cost Analytics
The same traffic, aggregated for spend.
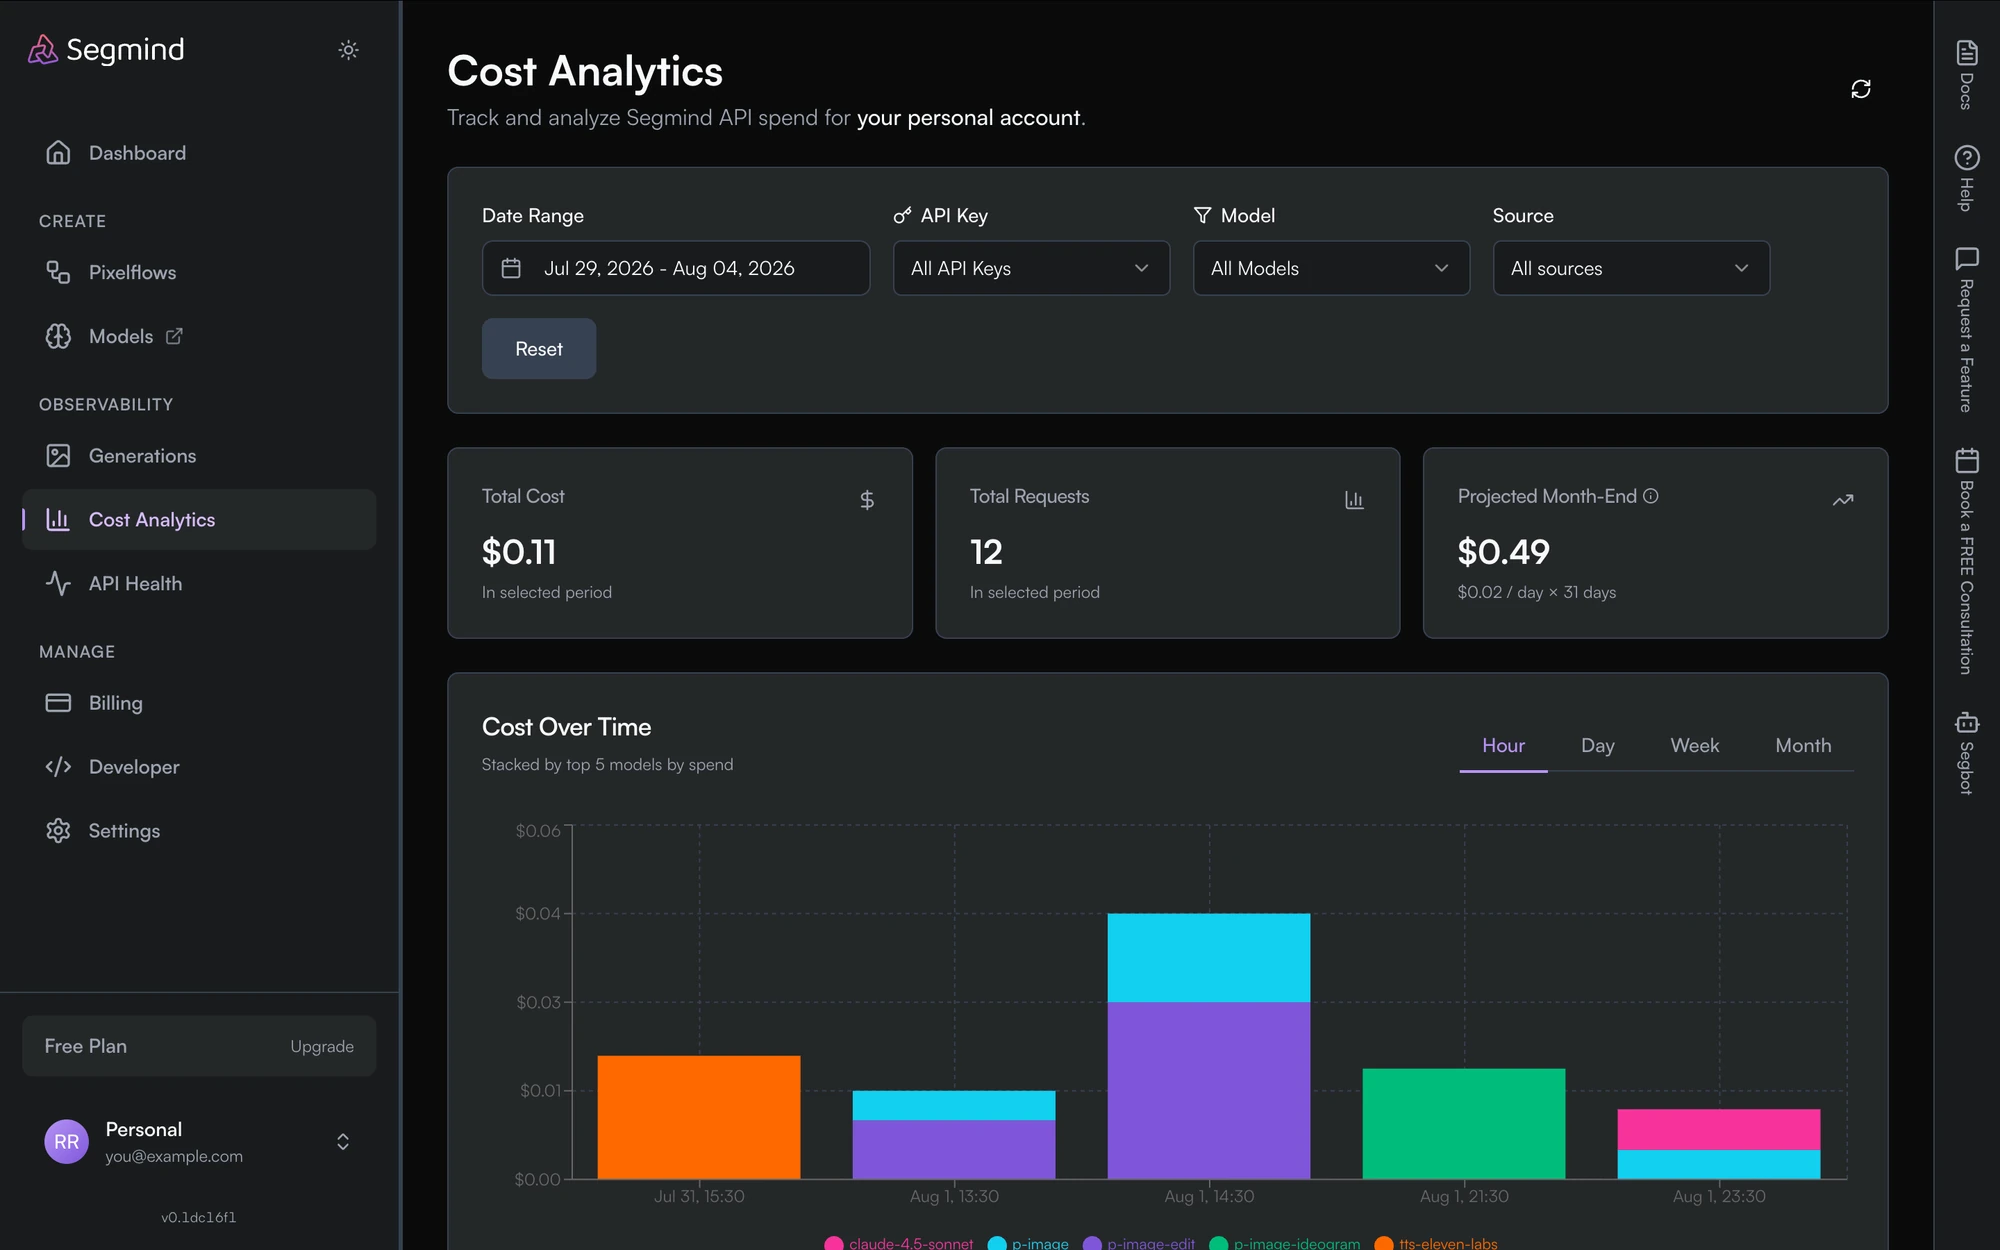
Three figures sit at the top, all for the selected period:
- Total Cost — what you spent.
- Total Requests — how many calls that was.
- Projected Month-End — the current daily average extended to the end of the month. It is a straight-line estimate, not a commitment.
Below them, Cost Over Time charts spend stacked by your top models, with Hour / Day / Week / Month granularity.
Breakdowns
Four tables follow, each with its own CSV export:
| Table | Breaks spend down by |
|---|---|
| Cost by Model | model slug, with request count and cost |
| Cost by Source | where the request came from. The Source filter names these API, Web (the playground and model pages) and Workflows (PixelFlow runs); the table lists the underlying source ids, which separate v1 and v2 traffic |
| Cost by API Key | which key was used, so you can attribute spend to an environment or a service |
| Cost by Team Member | per-member spend against the shared team wallet |
Cost by Source is the one worth checking first when a bill is surprising — it separates deliberate API traffic from playground experiments and PixelFlow runs, which are easy to forget about.
Cost by Team Member appears only on a team workspace, and only for its owner and admins. In a Personal workspace there is nothing to split, and a plain Member does not see what their colleagues spent. Per-member limits are set on the team management page.
Filters
Date Range, API Key, Model and Source apply to every card and table on the page at once, so narrowing to one model shows that model's chart, its share of each source, and its month-end projection together. Reset returns to the default range.
The date picker offers Last 7 days, Last 30 days, and Week, Month, Quarter and Year to date, or a custom range ending today.
The refresh control at the top right re-reads the figures without a full page reload.
API Health
Where Generations tells you what ran and Cost Analytics what it cost, API Health answers whether your traffic is actually healthy — and it is the page to open first when something feels slow or flaky.
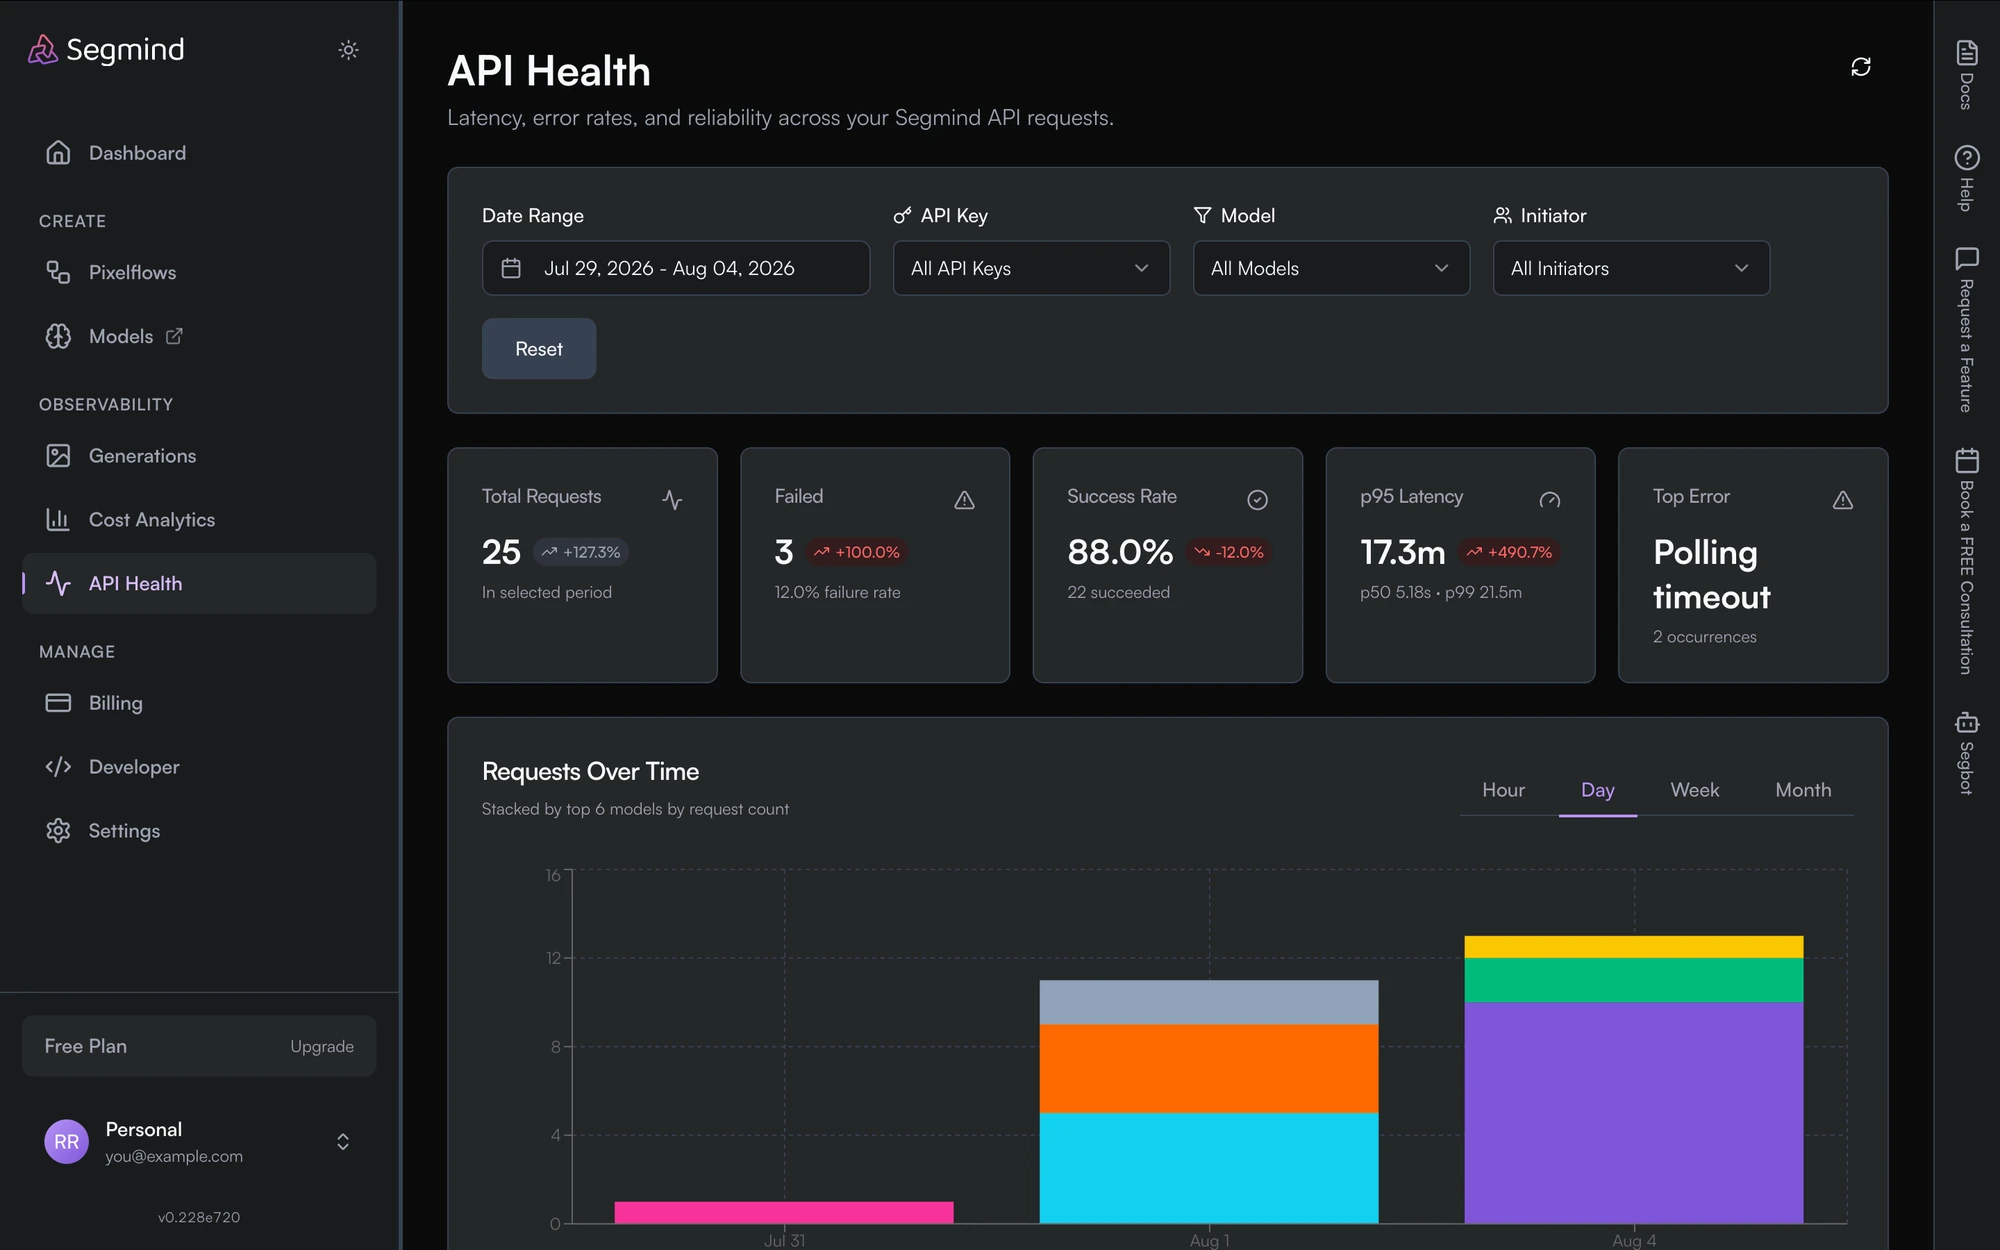
Five figures sit at the top, each with its change against the previous period of the same length:
| Card | Shows |
|---|---|
| Total Requests | how many calls in the period |
| Failed | how many failed, and the failure rate |
| Success Rate | the inverse, with the succeeded count |
| p95 Latency | with p50 and p99 underneath |
| Top Error | the most common failure, and how many times it happened |
Read p50 and p95 together. A p50 in seconds beside a p95 in minutes means most calls are fine and a few are stuck — usually a cold start or one bad model, not a general slowdown. See Model Status for why the first call to an idle model is slower.
Breakdowns
Requests Over Time charts volume stacked by your top models, with Hour / Day / Week / Month granularity. Below it:
- Requests by Model — with a CSV export.
- Top errors — failures grouped into families such as Polling timeout, Content policy, Input validation, Upstream 4xx, Upstream 5xx and Internal error. Each shows the message, when it was last seen, and how many models it affected.
- By model — reliability per model: requests, failed, success rate, p95 and cost. This is how you tell one unreliable model apart from a bad afternoon.
- By source — the same split as Cost Analytics, with latency instead of spend: API (direct REST calls from SDKs and integrations), Web (playground and dashboard traffic), Workflows (PixelFlow and published workflow runs), and Other.
- Recent failures — the 50 most recent failed requests for the current filters, with model, initiator, latency, error family and request id. Copy a request id from here to look the call up elsewhere.
Filters at the top — Date Range, API Key, Model and Initiator — apply to every card and table at once.
API Health reports your own traffic, not a global service status. A failure here is a failure of your requests — a rejected parameter or a model that timed out — which is why the error families and the per-model table matter more than the headline number.
Related
- Billing — how credits are reserved and settled, and what each model costs.
- API error codes — what each status code the gateway returns actually means.
Video Editing
Compose multi-track video with /v2/timeline, split a video into clips with /v2/video-split, and run thumbnail, GIF and format-conversion jobs — all on the same async contract as the models.
Logging
What Segmind logs for usage and billing, the data we never store, and how long files are held temporarily during model fine-tuning.